Jonas Sullivan · 21 October 2026
Regional Mapping Initiatives Track Vegetation Shifts to Guide Resource Planning Near Protected Zones
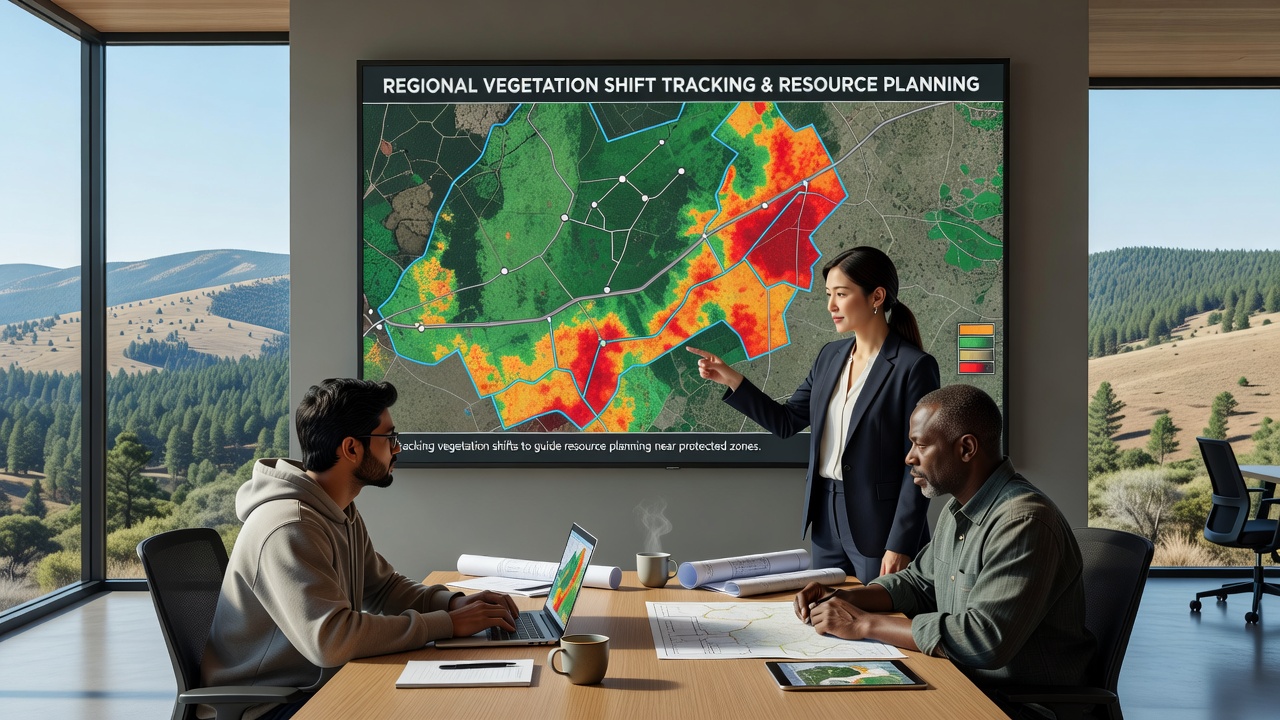
Regional mapping programs now combine satellite data, drone surveys, and ground observations to monitor how plant communities respond to changing climate conditions and land use pressures. These efforts focus on areas adjacent to national parks, wildlife refuges, and other protected zones where development decisions affect both ecological stability and community needs for water, timber, and recreation space. Data collected in recent years reveals measurable shifts in species distribution, canopy density, and seasonal growth cycles across multiple continents. Programs operating in the western United States rely on multispectral imagery from agencies such as the United States Geological Survey to detect early signs of drought stress in conifer forests bordering protected wilderness areas. Similar projects in Australia use LiDAR-equipped aircraft to map eucalyptus woodland changes around reserves managed by state conservation departments. European teams coordinated through the European Environment Agency apply repeated Sentinel satellite passes to track grassland transitions near Natura 2000 sites in Mediterranean and Alpine regions.Data Collection Methods and Technology Integration
Teams gather information through layered approaches that start with broad satellite coverage and narrow to detailed field sampling. Analysts process imagery to calculate normalized difference vegetation index values, which quantify plant health and biomass over time. When these indices show consistent decline or unexpected expansion, planners adjust zoning boundaries, irrigation allocations, and wildfire fuel management strategies before problems intensify.
October 2026 marked the release of updated regional datasets from several coordinated projects. These releases incorporated new high-resolution drone flights conducted during the previous summer and integrated them with long-term climate records. The resulting maps highlight corridors where vegetation types are migrating upslope or toward moister microclimates, information that resource agencies now use to prioritize land acquisitions and restoration plantings.
Applications in Resource Planning
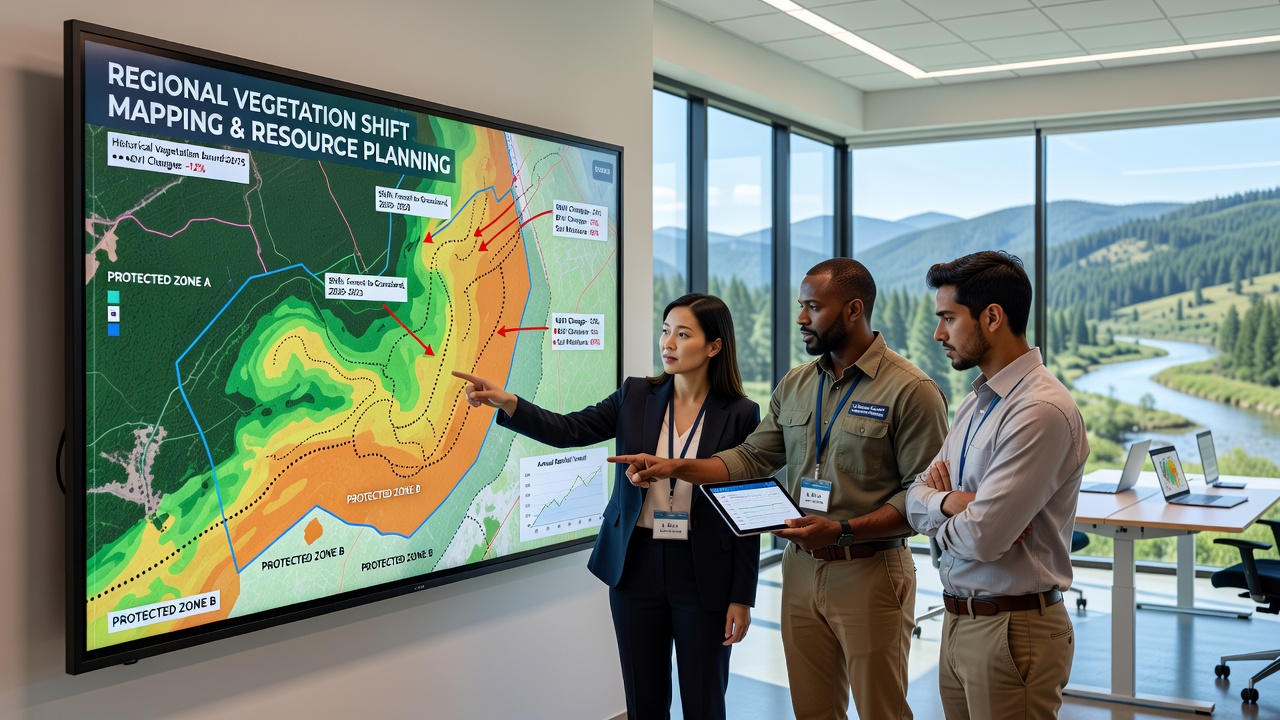 Planners consult these vegetation maps when evaluating proposals for new roads, housing developments, or agricultural expansions near protected boundaries. In regions where shrublands are replacing grasslands, water districts have revised reservoir release schedules to maintain downstream habitat connectivity. Forestry services in Canada have adjusted harvest schedules in zones where mapping shows increased vulnerability to insect outbreaks following warmer winters. One project in the Canadian Rockies documented a 12 percent increase in deciduous cover within buffer zones around national parks over a fifteen-year period. Officials responded by modifying grazing permits and trail maintenance schedules to reduce soil compaction that could accelerate further transitions. Another initiative along the Australian southeast coast identified salt-tolerant species moving inland from coastal reserves, prompting updated coastal planning guidelines that limit freshwater extraction in adjacent catchments.
Challenges in Data Interpretation and Coordination
Despite technological advances, teams still encounter difficulties when comparing datasets collected under different seasonal conditions or sensor resolutions. Cloud cover frequently interrupts optical satellite observations, while dense canopy layers obscure understory changes that ground crews must verify on foot. Cross-border projects face additional hurdles because data-sharing agreements and classification standards vary between countries.
Observers note that successful programs maintain long-term partnerships between universities, government agencies, and local land trusts. These collaborations allow continuous refinement of mapping protocols and quicker translation of findings into policy adjustments. In October 2026 several such partnerships announced joint training workshops designed to standardize field verification techniques across multiple jurisdictions.
Future Directions and Ongoing Monitoring
Researchers continue to expand the use of machine learning models that predict future vegetation configurations based on current trends and climate projections. These models help planners test scenarios for different levels of resource extraction or conservation investment. As sensor costs decline, more community groups gain access to tools that let them contribute localized observations to regional databases.
Protected zone managers increasingly treat vegetation maps as living documents updated on annual or biannual cycles rather than static reference materials. This approach allows rapid response when mapping detects sudden die-offs or invasive species incursions near park perimeters. The result is a more adaptive framework for balancing human resource needs with the preservation of ecological integrity in surrounding landscapes.
Conclusion
Regional mapping initiatives provide the factual foundation for decisions that affect both protected areas and the communities that depend on nearby natural resources. Continued investment in technology and cross-jurisdictional coordination sustains the flow of reliable data required for long-term planning. As vegetation patterns keep evolving, these programs remain central to maintaining functional buffer zones around conserved lands.